Java Code Profiling is a common requirement in projects for analyzing performance bottlenecks. Although there are quite a few commercial tools available for this, but I found the following free/open-source tools extremely helpful.
Tools Overview
TPTP ProfilingTest and Performance Tools Platform (TPTP) is an Eclipse project and it can downloaded either as a complete Eclipse runtime or a plugin that can be installed on your current eclipse installation. The tool is tightly integrated with Eclipse, allowing profiling of applications running from within Eclipse. Thus this can not be used to profile applications running on a Unix server for e.g. Such applications cab be profiled using the JIP profiler (see below). Here we show how to download, install and use the TPTP profiler to profile a Java application. Installation1. Download Eclipse 3.4.1 or 3.4.2 (Ganymede) runtime(if you don’t already have it) and install it in c:\eclipse 2. Download the TPTP platform runtime and trace runtime and install it on top of your eclipse platform 3. Make sure you have JDK 5 installed on your system. 4. Create a shortcut to Eclipse and modify the shortcut target to start Eclipse with the following options: C:\eclipse\eclipse.exe -vm “C:\jdk1.5.0_18\bin\javaw.exe” -vmargs -Xms128M -Xmx512M -XX:PermSize=128M -XX:MaxPermSize=256M 5. Import the application and set the classpath as required:
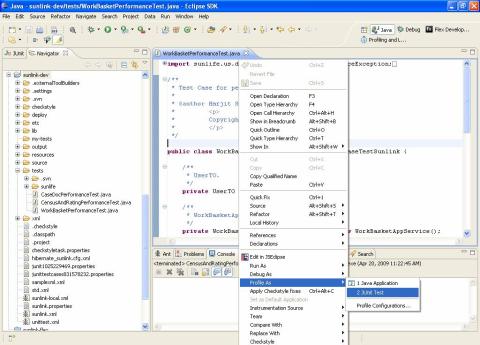
Usage1. Run the JUnit through TPTP profiling:
2. Specify profile configuration:
3. Modify filters (double click on Java Profiling):
4. Start Profiling:
JIP ProfilingJava Interactive Profiler (JIP) is a pure java profiler and it gets attached to the JVM as a java agent to collect performance statistics. It is different from other java agent based profilers since it lets you control the profiling while your application is running. Most other java profilers start when your program starts and end when the JVM exits. In many cases this doesn’t give you a true measure of performance since the Just In Time compiler doesn’t compile code on the first pass. In addition, this type of profiler is not useable at all in web applications since you end up profiling the web container as well as the web application. JIP, on the other hand, allows you to turn the profiler on and off while the JVM is running. Here we show how to download, install and use JIP to profile an application. Installation1. Download JIP binaries and unzip it in some folder say (c:\jip-1.1.1) 2. Copy the profiler.jar and profile.properties from c:\jip-1.1.1\profile to a folder on the server (say /devel/performance) 3. Create a shell script, say runtest.sh and specify the JAVA_HOME as a JDK 5 folder on the server. Also set the classpath with all the jar files needed by the Junit test case that you want to profile. Usage1. Run the following command (through the above shell script) to start the profiler: $JAVA_HOME/bin/java -javaagent:./profile.jar -Djip.OUTFILE=./profile.txt -Dprofile.properties=./profile.properties junit.textui.TestRunner WorkBasketPerformanceTest You may also profile the JUnit test case as a java program if you put the following method in the test case: public static void main(String args[]) {junit.textui.TestRunner.run (WorkBasketPerformanceTest.class); Here is the command to run the test case as a Java program: $JAVA_HOME/bin/java -javaagent:./profile.jar -Djip.OUTFILE=./profile.txt -Dprofile.properties=./profile.properties WorkBasketPerformanceTest 2. Copy the generated profile.xml (from /devel/performance) to your local folder: c:\jip-1.1.1\client 3. Now you may view the profiler output through the following command: c:\jdk1.5.0_18\bin\java -jar jipViewer.jar profile.xml 4. Here is a sample output:
|


